def TopTwo(db_name):
    '''
    applies top two runoff to data in db_name
    returns resulting preference
    '''
    try:
        with get_voter_db() as conn:
            to_return = []
            remaining = list(get_results(db_name))
            cursor = conn.cursor()
            while len(remaining) > 1: #iterates rounds of runoff until full preference profile created
                cmd = f"""
                SELECT rank1
                FROM {db_name}
                WHERE rank1 IN {tuple(remaining)}
                GROUP BY rank1
                ORDER BY COUNT(rank1) DESC
                """ #run plurality on remaining candidates
                cursor.execute(cmd)
                fetch = cursor.fetchall()
                top_two = [fetch[0][0],fetch[1][0]] #extract top two

                #find relative ranking between current top two candidates
                count1 = np.sum([get_ranks(top_two[0],db_name)<get_ranks(top_two[1],db_name)])
                count2 = np.sum([get_ranks(top_two[0],db_name)>get_ranks(top_two[1],db_name)])

                #update to_return and remaining accordingly
                if count1 > count2:
                    to_return += [top_two[0]]
                    remaining.remove(top_two[0])
                else:
                    to_return += [top_two[1]]
                    remaining.remove(top_two[1])

            return (to_return + remaining)[:5]
    except: #in the case that plurality() only returns one result, will return that one element
return [plurality(db_name)[0][0]]Introduction
This project is an interactive dynamic website that aims to educate users on ranked choice voting systems and their fairness. We structured the website as portrayed in the following flowchart, which we believe provides an effective educational experience.

Overall, we discuss five different kinds of voting systems: plurality, Borda count, instant runoff, top two runoff, and dictatorship. For each voting system we explain how they work and whether or not they satisfy certain fairness criteria. We also implement functions that run each voting system on a dataset of ranked choice votes from the Alaska 2020 Democratic primary. Users of the website are able to see the results and, to a certain extent, modify the voting systems to see how results change. At the end, we allow users to vote on their favorite voting systems and see which voting system is the collective favorite based on each voting system, in a somewhat meta fashion.
There are three technical components constituting the project: We use SQL by means of sqlite3 to create a database that stores the Alaska voting data as well as the website users’ votes on their favorite voting systems. We then implement the voting systems as functions that rely on SQL queries. We construct a complex data visualization (namely, a sankey diagram) using plotly to better portray the results of instant runoff on the Alaska data. We also write code which can display the results of other voting systems as bar graphs. We use Flask, HTML, and CSS to implement the front end of the website, ensuring that it is a functional dynamic website.
We explain each component in detail throughout the remainder of the blog post. We cover the most important technical aspects of each component, and encourage the reader to reference our github project for the code snippets which we do not have time to cover in as thorough detail.
Component 1: Implementation of Voting Systems Using SQL
All of the functions used to implement voting systems are contained in and imported from the voting_systems.py file. These functions access the voter_data SQL database, but most are designed to be applied to any table of ranked choice voting data within that database with five rank columns. Most of them have fairly simple implementations.
First, as in Homework 3, get_voter_db() uses try except blocks to return the database connection if it exists, and create it if not. The data is cleaned as well: in the original data there are multiple entries that, for our purposes, count as a non-applicable vote. Strictly speaking, a lot of data does not fit what we mean when we say ranked choice data (this is touched on in the website), but because most voting systems are still applicable to it, we chose to include it.
We have two helper functions get_results(), which is hard-coded to return all possible candidates in a data table (this speeds up the runoff algorithms), and get_ranks(), which returns a Numpy array of ranks of a given candidate. For the voting systems themselves, plurality(), borda(), and dictatorship() are easy implementations using SQL. In particular dictatorship() allows the user to choose the dictator by inputting the index.
When it comes to the runoff functions, however, things get a little bit more complicated. These voting systems consist of rounds, after which the rank of one candidate is decided and the algorithm is run again on the remaining candidates. The IRV() function is explained in more detail later, but let’s take a look at toptwo().
In an edge case in which plurality only returns one candidate, we return that candidate. Otherwise, we have two lists, to_return and remaining, which keep track of those candidates whose ranks have been decided already and those who still have to go through runoff rounds, respectively. During each round, plurality is run by means of SQL on the candidates still in remaining, and the top two ranks are extracted. The relative ranks of only these two candidates are compared using get_ranks(); for example, if one voter voted Candidate A in rank 2 and Candidate B in rank 4, this would count as a vote for Candidate A. The winner is ranked the next highest after whichever candidates are already in to_return, and the lists are updated for another round of runoff voting. This iterates until we have a complete ranking of the candidates, which is then returned.
When applicable the voting algorithm functions return a list of tuples of candidates with associated values, which are then displayed on the website. Otherwise, they return only a ranking of candidates or, in the case of dictatorship(), one candidate only. We can see two examples with plurality():
and IRV():
The last few functions pertain only to the ranking_votes table in the database, where users are able to vote on their favorite voting systems at the end of the website. The add_vote() function takes in a list of user input ordered in descending order of ranks, and inputs it into the database. When displaying the results we use get_favorite_systems(), which runs each voting algorithm on the database and returns a dictionary of first place results. Finally, we have view_rankings() and clear_rankings(), which were constructed for debugging purposes. Although view_rankings() is never accessed through the website, we’ve coded in a little easter egg that allows us to clear rankings if we ever want to reset the data for some reason.
Component 2: Plotly visualizations
Of course, we cannot forget that the goal of this project is to educate the website user about the fairness of voting systems and how they can influence elections. We aim to do so using the Alaska 2020 Democratic primary election data. However, the website would not be an effective educational tool if it only included text explanation of the voting systems and Alaska election data. So, we have included three different visualizations of various parts of the data to provide a better educational experience:
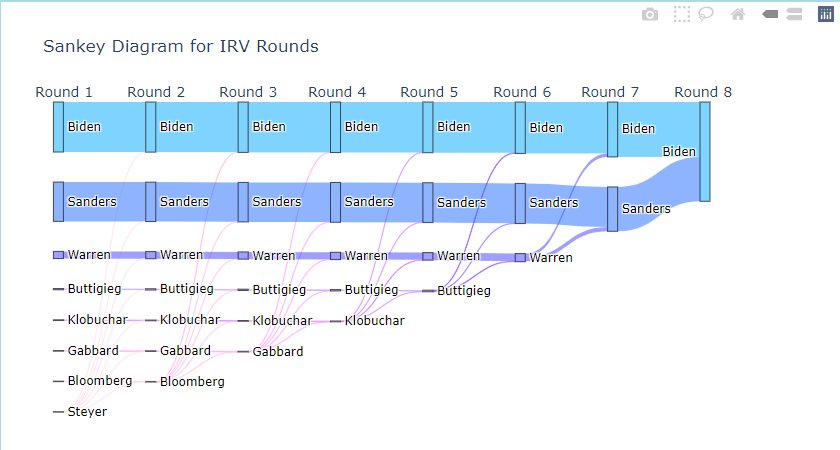
- the most complex visualization is an interactive sankey diagram portraying the rounds of instant runoff voting;
- we also include bar graphs for the plurality and borda count voting systems;
- and lastly we include tables of the rankings determined by the plurality, borda count, instant runoff, and top two runoff systems.
We discuss the sankey diagram in detail and briefly touch on the bar graphs and tables.
When discussing our use of SQL, we explained the code for the TopTwo() function in voting_systems.py which implements the top two runoff voting system. We also have the IRV() function in voting_systems.py which implements the instant runoff voting system as seen below.
def IRV(db_name):
    '''
    applies instant runoff vote to data in db_name
    returns resulting preference as well as associated
    source, target, and value lists for a Sankey diagram
    '''
    can_win = get_results(db_name) #remaining possible winning candidates
    to_return = []
    with get_voter_db() as conn:
        cursor = conn.cursor()


        #variables needed for Sankey diagram
        count = 0
        labelList = []      #keeps order of ranking of candidates each round
        sourceList = []     #keeps track of where votes move from
        targetList = []     #keeps track of where votes move to
        valuesList = []     #keeps track of how many votes move
        talliesOld = []     #keeps track of prior round results

        while len(can_win)>1: #iterates rounds of instant runoff
            votes=[]
            talliesNew=[]
            can_win_str = tuple(can_win)

            #count number of first place votes in current iteration of instant runoff
            #only takes into account candidates in can_win when determining rank
            cmd = f"SELECT rank1,COUNT(rank1) FROM {db_name} WHERE rank1 IN {can_win_str} GROUP BY rank1"
            cursor.execute(cmd)
            votes += [cursor.fetchall()]

            cmd = f"SELECT rank2,COUNT(rank2) FROM {db_name} \
            WHERE rank2 IN {can_win_str} AND rank1 NOT IN {can_win_str} GROUP BY rank2"
            cursor.execute(cmd)
            votes += [cursor.fetchall()]

            cmd = f"SELECT rank3,COUNT(rank3) FROM {db_name} \
            WHERE rank3 IN {can_win_str} AND rank1 NOT IN {can_win_str} AND rank2 NOT IN {can_win_str} \
            GROUP BY rank3"
            cursor.execute(cmd)
            votes += [cursor.fetchall()]

            cmd = f"SELECT rank4,COUNT(rank4) FROM {db_name} \
            WHERE rank4 IN {can_win_str} AND rank1 NOT IN {can_win_str} AND rank2 NOT IN {can_win_str} \
            AND rank3 NOT IN {can_win_str} \
            GROUP BY rank4"
            cursor.execute(cmd)
            votes += [cursor.fetchall()]

            cmd = f"SELECT rank5,COUNT(rank5) FROM {db_name} \
            WHERE rank5 IN {can_win_str} AND rank1 NOT IN {can_win_str} AND rank2 NOT IN {can_win_str} \
            AND rank3 NOT IN {can_win_str} AND rank4 NOT IN {can_win_str} \
            GROUP BY rank5"
            cursor.execute(cmd)
            votes += [cursor.fetchall()]

            #consolidate votes for each candidate
            for person in can_win:
                vote_count = sum([dict(votes[i]).get(person,0) for i in range(5)])
                talliesNew += [(person,vote_count)]

            #determine last place in current round of instant runoff
            talliesNew = sorted(talliesNew,key=lambda x:-x[1])
            last_place = talliesNew[-1][0]

            #update to_return and can_win
            to_return = [last_place] + to_return
            can_win.remove(last_place)


            #determining source, target, and value for this round of IRV
            if talliesOld:
                tupleLast = talliesOld[-1]
                addLast = tupleLast[0].split()[-1]+str(count-1)

                for tupleOld in talliesOld[:-1]:
                    add = tupleOld[0].split()[-1]

                    labelList += [add+str(count-1)]

                    sourceList += [add+str(count-1)]
                    targetList += [add+str(count)]
                    valuesList += [tupleOld[1]]

                    sourceList += [addLast]
                    targetList += [add+str(count)]
                    for tupleNew in talliesNew:
                        if tupleNew[0] == tupleOld[0]:
                            valuesList += [tupleNew[1]-tupleOld[1]]

                labelList += [addLast]

            #updating to keep track of prior round
            talliesOld = talliesNew
            count += 1

        # determining overall rankings
        rankings = can_win + to_return


        # finish constructing label, source, target, and value lists
        winnerName = can_win[0].split()[-1]+str(count)

        labelList += [tupleNew[0].split()[-1]+str(count-1) for tupleNew in talliesNew]
        labelList += [winnerName]

        sourceList += [talliesOld[0][0].split()[-1]+str(count-1), talliesOld[1][0].split()[-1]+str(count-1)]
        targetList += [winnerName, winnerName]
        valuesList += [talliesOld[0][1], talliesOld[1][1]]

        return rankings, labelList, sourceList, targetList, valuesList
In a particular round of instant runoff voting (meaning a particular iteration of the while-loop), this function conducts five SQL queries to determine:
- how many voters ranked each of the remaining candidates first; Of the voters whose top choice has already been eliminated, how many voters ranked each of the remaining candidates second;
- Of the voters whose top two choice have already been eliminated, how many ranked each of the remaining candidates third;
- and so on.
The SQL-related code in this function uses the same techniques used in any of the functions described in the prior section. So, we instead focus on what makes IRV() unique: it also creates the objects necessary for a sankey plot while conducting the SQL queries. Indeed IRV() creates the lists sourceList, targetList, and valuesList while running the while-loop that conducts the rounds of instant runoff. The j-th component of each of these three lists encodes how valuesList[j] many votes moved from the candidate named sourceList[j] to the candidate named targetList[j] during a particular round of instant runoff, by using this code snippet within the while-loop
if talliesOld:
                tupleLast = talliesOld[-1]
                addLast = tupleLast[0].split()[-1]+str(count-1)

                for tupleOld in talliesOld[:-1]:
                    add = tupleOld[0].split()[-1]

                    labelList += [add+str(count-1)]

                    sourceList += [add+str(count-1)]
                    targetList += [add+str(count)]
                    valuesList += [tupleOld[1]]

                    sourceList += [addLast]
                    targetList += [add+str(count)]
                    for tupleNew in talliesNew:
                        if tupleNew[0] == tupleOld[0]:
                            valuesList += [tupleNew[1]-tupleOld[1]]

                labelList += [addLast]
and this following code snippet right outside the while-loop
 # determining overall rankings
        rankings = can_win + to_return


        # finish constructing label, source, target, and value lists
        winnerName = can_win[0].split()[-1]+str(count)

        labelList += [tupleNew[0].split()[-1]+str(count-1) for tupleNew in talliesNew]
        labelList += [winnerName]

        sourceList += [talliesOld[0][0].split()[-1]+str(count-1), talliesOld[1][0].split()[-1]+str(count-1)]
        targetList += [winnerName, winnerName]
        valuesList += [talliesOld[0][1], talliesOld[1][1]]
The first code snippet (from within the while loop) ensures that if a candidate survived the prior round, then all of that candidate’s votes from the prior round stay with them in the current round. It then calculates and stores how many votes move from the candidate that got removed during the previous round to the candidates that survived to the current round. The second code snippet (outside of the while loop) conducts the analogous computations for the final round of instant runoff voting, due to technical reasons for when we need the while loop to halt. Overall, the lists sourceList, targetList, and valuesList will allow the sankey diagram to create the connections between nodes demonstrating how votes move between candidates.
IRV() also returns the list labelList which includes all of the candidates’ names in order of how the were ranked the first round, and then all of the remaining candidates in order of how they were ranked the second round, and then all of the remaining candidates in order of how they were ranked the third round, and so on. labelList will allow the sankey diagram to visualize the votes that each candidate has during each round.
Lastly, IRV() returns the list rankings which simply is the list of candidates ordered from first to last place as determined by instant runoff. rankings will be used later on to display the final results of IRV() in a chart.
Now that we have covered IRV() and how it creates the objects necessary for a sankey plot, we can discuss the function IRV_sankey() in the plot_data.py file which is defined as follows.
def IRV_sankey(rankings, labelList, sourceList, targetList, valuesList):
    """
    creates a sankey plot for the IRV data
    args:
        rankings:   list of candidate rankings in order from first place
                    to last place (produced by voting_systems.IRV())
        labelList:  list of candidates in order of how they ranked each round
                    (produced by voting_systems.IRV())
        sourceList: list of candidates from which votes will move
                    (produced by voting_systems.IRV())
        targetList: list of candidates to which votes will move
                    (produced by voting_systems.IRV())
        valuesList: list of how many votes move from between candidates
                    (produced by voting_systems.IRV())
    returns:
        a sankey plot in the form of a JSON object
    """
    n = len(rankings)


    # Node position
    xList = [round(j/n+0.01,3) for j in range(n) for name in rankings[:n-j]]
    yList = [round(k/n+0.01,3) for j in range(n) for k in range(len(rankings[:n-j]))]


    # Node and link colors
    ColorDict = {rankings[j].split()[-1] : f'hsva({200+20*j},{100-12.5*j}%,100%,0.5)' for j in range(n)}
    nodeColorList = [ColorDict[name[:-1]] for name in labelList]
    linkColorList = [ColorDict[name[:-1]] for name in sourceList]


    # encoding labels for source and target lists
    indices = {key: val for val, key in enumerate(labelList)}
    sourceList = [indices.get(item,item)  for item in sourceList]
    targetList = [indices.get(item,item)  for item in targetList]


    # Removing indices at end of names for presentation
    labelList = [name[:-1] for name in labelList]

    # Creating sankey figure
    fig = go.Figure(data=[go.Sankey(arrangement='snap',
                                    node = dict(pad = 30,
                                                thickness = 10,
                                                line = dict(color = "black",
                                                            width = 0.5),
                                                label = labelList,
                                                color = nodeColorList,
                                                x = xList,
                                                y = yList,
                                                hovertemplate='%{value} votes<extra></extra>'),
                                    link = dict(source = sourceList,
                                                target = targetList,
                                                value = valuesList,
                                                color = linkColorList,
                                                hovertemplate='%{value} votes move from %{source.label} to %{target.label}<extra></extra>'))])


    # adding labels for each round of IRV
    for j in range(n):
        columnTitle = f"Round {j+1}"        # label text
        xCoord = j/8+(j//3)*0.037 - 0.025   # label position
        fig.add_annotation(x = xCoord,
                        y = 1.07,
                        xref = "paper",
                        yref = "paper",
                        text = columnTitle,
                        showarrow = False,
                        font = dict(size=14))

    # adding figure title and adjusting margins
    fig.update_layout(title_text = "Sankey Diagram for IRV Rounds",
                      margin = {"r":50,"t":100,"l":50,"b":50},
                      font_size = 12)


    # converting figure into a json object
    return json.dumps(fig, cls=plotly.utils.PlotlyJSONEncoder)
This function takes in the results of IRV() as parameters and returns the sankey diagram using plotly. Here is a step-by-step breakdown of how IRV_sankey() works.
- The function creates the lists
xListandyListwhich will help determine the positions of the nodes representing the candidates during each round. - The function then creates the lists
nodeColorListandlinkColorListwhich encode how to color the nodes representing each candidate and the links representing how votes move between candidates. In each round, the highest-ranked candidates will be colored shades of blue, the middle-ranked candidates will be colored shades of purple, and the lowest-ranked candidates will be colored shades of pink. A link leaving a node will share the same color as that node. - The function then edits
sourceListandtargetListto be numerical encodings representing the candidate nodes each round, rather than strings. This is easier forplotlyto interpret. - The function also edits
labelListto display nicely. This cannot be done earlier due to technical reasons with indexing. - Most importantly, the function uses
go.Sankeyto create the sankey diagram as a figure. The following for-loop adds annotations to the figure labeling the rounds of instant runoff. Thenfig.upate_layout()is used to give the figure a title, adjust the margins, and adjust the font sizes. - Finally, the function saves the figure as a JSON encoded figure, as this is the format we need to display the diagram on our website via HTML.
Phew, that’s a lot! Here is a screenshot of the outcome, which we analyze on our website.
The module plot_data.py also includes two other functions, plurality_plot() and borda_plot(), which are used to generate bar graphs of the number of votes and points each top five ranking candidate received under plurality and borda count, respectively. These functions use the same coding techniques as IRV_sankey(), such as returning the figures in a JSON encoded form, but are much simpler since bar graphs are much easier to construct.
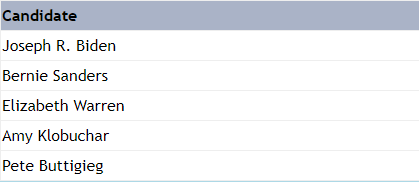
Lastly, we also have the module get_data.py, which includes all the functions needed for converting the rankings determined by the voting system functions (from voting_systems.py) into tables that can be displayed correctly on the website via HTML. These functions all only include a few lines of code and are quite explanatory. For example, here is the code for the function that creates the table for instant runoff rankings:
def get_irv_df():
    """
    converts the instant runoff data into a pandas dataframe
    args:
        none
    returns:
        a pandas dataframe that contains all the instant runoff data
    """
    # getting instant runoff count data using the IRV() function in voting_systems.py
    # data in the form of a list of tuples
    rankings, label, source, target, value  = voting_systems.IRV("votes")
    irvList = rankings[:5]
    # converting data into pandas dataframe
    irvDF = pd.DataFrame(irvList, columns = ['Rankings'])
    return irvDF, rankings, label, source, target, value
The function simply returns the same objects as IRV() except with rankings being converted into a pandas dataframe shortened to contain only the top five candidates.
Component 3: Front End Development Using Flask
We are now ready to explain how we built the website using Flask. The website follows the flowchart from the introduction to this blog post. We explain each step of the flowchart in order. Note the design of each page of the website is determined by the style.css file in the static folder as well as corresponding html templates in the templates folder. Moreover, each page is rendered using a corresponding render function from the file app.py.
First, we wrote a base html script called bigbase.html that ensures each page of the website has the same title and navigation bar at the top:
<link rel="stylesheet" href="{{ url_for('static', filename='style.css') }}">

<title>Different Types of Voting Systems</title>
<link rel="icon" type="image/x-icon" href="{{ url_for('static', filename='favicon.ico') }}">

{% block header %}
    <h1> Know Your Voting Systems </h1>
    <h2>(and why they are bad)</h2>

    <div class = "nav">
        <a href="{{ url_for('render_home')  }}">Home</a>
        <a href="{{ url_for('render_intro')  }}">What Is R.C. Voting</a>
        <a href="{{ url_for('render_intro2')  }}">Fairness of R.C. Voting</a>
        <a href="{{ url_for('render_start')  }}">Play With Voting</a>
        <a href="{{ url_for('render_choice')  }}">Vote for Your Favorite System</a>
    </div>
{% endblock %}

{% block text %}
{% endblock %}

{% block links %}
{% endblock %}

{% block line %}
{% endblock %}

{% block header2 %}
{% endblock %}

{% block content %}
{% endblock %}

{% block plot %}
{% endblock %}

{% block results %}
{% endblock %}

{% block button %}
{% endblock %}
Each page of our website will extend bigbase.html by using some of the empty blocks.
The first three pages of the website are simply text explanations of the “theory” behind understanding voting. The first page sets up the main questions we will explore, the second page explains what ranked choice voting systems are, and the third page explains the fairness criteria of unanimity and IIA. The html scripts for these pages are home.html, intro.html, and intro2.html. The html implementations for all three of these pages are extremely similar, and so we only show home.html below.
{% extends 'bigbase.html' %}

<link rel="stylesheet" href="{{ url_for('static', filename='style.css') }}">

{% block text %}
<body>
    <p>
        Politics: the best topic to bring up at the Thanksgiving dinner table. We all spend hours debating and debating on certain policies and why or why not they should get enacted. However, have you ever stopped to think the voting systems that we use to decide on and enact these policies? For example:
    </p>
    <ul>
        <li>Why is your local government using the voting system that it is?</li>
        <li>Are some voting systems more fair than others?</li>
        <li>What makes a voting system fair in the first place?</li>
    </ul>
    <p>
        These questions may initially seem unassuming–of course our voting systems are fair, it’s the people’s voice after all! However, as soon as we rigorously (meaning, mathematically) tackle these concepts and issues, we come to the following two startling conclusions.
    </p>
    <ol type="1">
        <li>The only voting system that satisfies all of our intuitive notions of fairness is a dictatorship.</li>
        <li>Different voting systems that may each seem fair can lead to vastly different outcomes that may especially benefit particular individuals or groups of people.</li>
    </ol>
    <p>
        The goal of this website is to explain points 1 and 2, to allow for a better understanding of the voting systems that affect your everyday life. We offer the following resources:
    </p>
    <ul>
        <li>A page where we explain what a ranked choice voting system is.</li>
        <li>A page where we explain notions of fairness in voting and points 1 and 2.</li>
        <li>A page allowing you the user to explore the results of various voting systems on the voter data from the 2020 Alaska democratic primary.</li>
        <li>A page where you the user can vote on which voting system is your favorite. We then display the winner of the vote (among all users) according to each voting system.</li>
    </ul>
</body>
{% endblock %}

{% block button %}
<div class = "CENTER">
    <a href = "{{ url_for('render_intro')  }}" >
        <button>START</button>
    </a>
</div>
{% endblock %}
Note that home.html extends bigbase.html by using the text and button blocks. The text block, as you have guessed, contains the explanatory text displayed on the page. The button block includes the html for a centered start button which navigates to the next page, which is given by into.html. We render home.html with the simple render function
@app.route("/")
def render_home():
    """
    renders the home.html template
    args:
        none
    returns:
        a generated template file
    """
    return render_template("home.html")
which gives the following result:
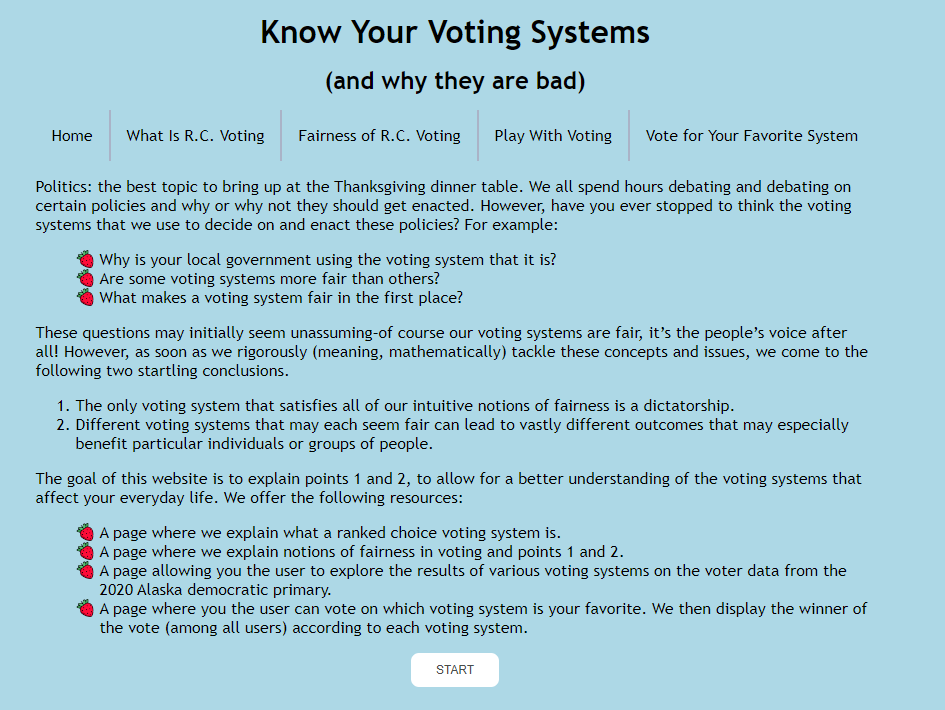
Notice that the title and navigation bar are determined by bigbase.html while the text and the start button underneath are determined by home.html.
After the explanatory pages is the “Play With Voting” page, which allows users to see the results of using different voting systems on the Alaska election data. For this page, we wrote the file littlebase.html
{% extends 'bigbase.html' %}
{% block text %}
<p>
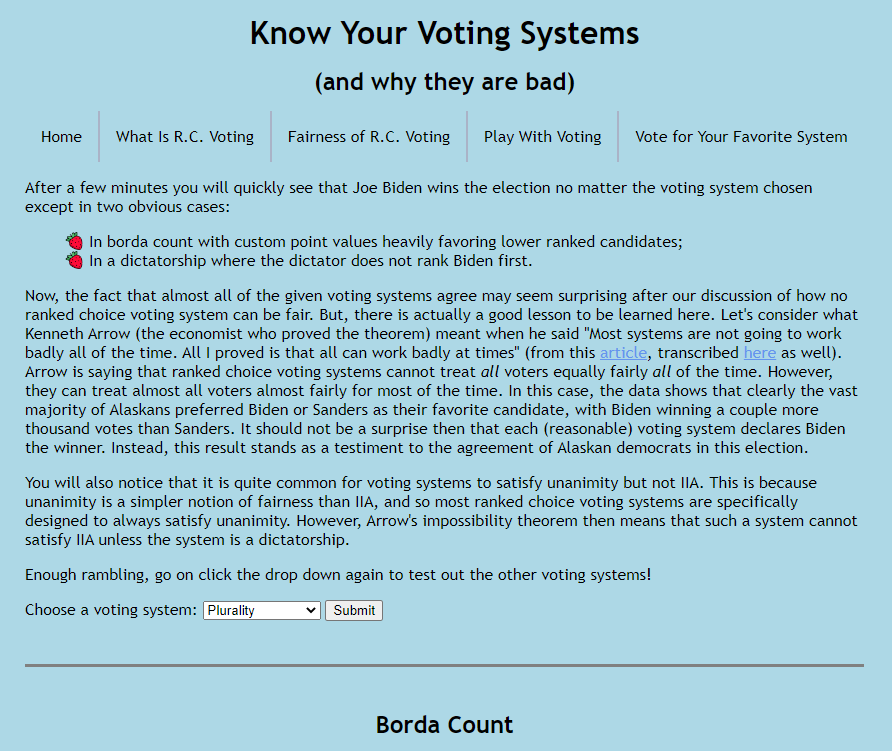
After a few minutes you will quickly see that Joe Biden wins the election no matter the voting system chosen except in two obvious cases:
<ul>
<li>In borda count with custom point values heavily favoring lower ranked candidates;</li>
<li>In a dictatorship where the dictator does not rank Biden first.</li>
</ul>
Now, the fact that almost all of the given voting systems agree may seem surprising after our discussion of how
no ranked choice voting system can be fair. But, there is actually a good lesson to be learned here. Let's consider what
Kenneth Arrow (the economist who proved the theorem) meant when he said "Most systems are not going to work badly all of the
time. All I proved is that all can work badly at times" (from this <a href="https://www.sciencedirect.com/science/article/abs/pii/S0262407908609148?via%3Dihub" target="_blank">article</a>,
transcribed <a href="https://rangevoting.org/McKennaText.txt" target="_blank">here</a> as well). Arrow is saying that ranked choice
voting systems cannot treat <em>all</em> voters equally fairly <em>all</em> of the time. However, they can treat almost all voters
almost fairly for most of the time. In this case, the data shows that clearly the vast majority of Alaskans preferred Biden or Sanders
as their favorite candidate, with Biden winning a couple more thousand votes than Sanders. It should not be a surprise then that each
(reasonable) voting system declares Biden the winner. Instead, this result stands as a testiment to the agreement of Alaskan democrats
in this election.
</p>
</p>
You will also notice that it is quite common for voting systems to satisfy unanimity but not IIA. This is because unanimity is a simpler
notion of fairness than IIA, and so most ranked choice voting systems are specifically designed to always satisfy unanimity. However, Arrow's
impossibility theorem then means that such a system cannot satisfy IIA unless the system is a dictatorship.
</p>
<p>
Enough rambling, go on click the drop down again to test out the other voting systems!
</p>
{% endblock %}
{% block links %}
<form method = post>
<label for = 'system'>Choose a voting system:</label>
<select id = 'system' name = 'system'>
<option value = 'render_plurality'>Plurality</option>
<option value = 'render_borda'>Borda Count</option>
<option value = 'render_irv'>Instant Runoff</option>
<option value = 'render_toptwo'>Top-Two Runoff</option>
<option value = 'render_dictatorship'>Dictatorship</option>
</select>
<input type="submit" name = "submit" value="Submit">
</form>
{% endblock %}
{% block line %}
<br>
<hr class="solid">
<br>
{% endblock %}
{% block header2 %}
{% endblock %}
{% block content %}
{% endblock %}
{% block plot %}
{% endblock %}
{% block results %}
{% endblock %}
<br>
{% block button %}
<div class = "BACK">
<a href = "{{ url_for('render_intro2') }}" >
<button>BACK</button>
</a>
</div>
<div class = "NEXT">
<a href = "{{ url_for('render_choice') }}" >
<button>NEXT</button>
</a>
</div>
{% endblock %}and the file start.html
{% extends 'littlebase.html' %}
{% block text %}
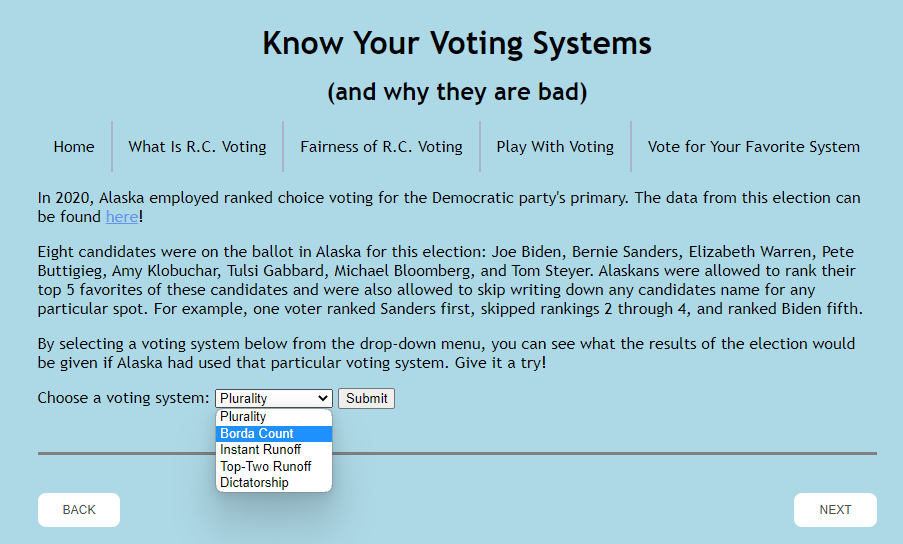
<p>In 2020, Alaska employed ranked choice voting for the Democratic party's primary. The data from this election can be found
<a href="https://dataverse.harvard.edu/file.xhtml?fileId=6377197&version=5.0" target="_blank">here</a>!</p>
<p>Eight candidates were on the ballot in Alaska for this election: Joe Biden, Bernie Sanders, Elizabeth Warren,
Pete Buttigieg, Amy Klobuchar, Tulsi Gabbard, Michael Bloomberg, and Tom Steyer. Alaskans were allowed to rank
their top 5 favorites of these candidates and were also allowed to skip writing down any candidates name for any
particular spot. For example, one voter ranked Sanders first, skipped rankings 2 through 4, and ranked Biden fifth.</p>
<p>By selecting a voting system below from the drop-down menu, you can see what the results of the election would be given
if Alaska had used that particular voting system. Give it a try!</p>
{% endblock %}The template littlebase.html creates the dropdown of options for voting systems to choose from, while determining some text to show at the top of the page once the user chooses a voting system from the drop down menu. Meanwhile, start.html extends littlebase.html by replacing the initial text with a paragraph that will only show when users navigate to the page by clicking on the navigation bar or via the start/back buttons. Thus, the page looks like this when first navigating to it
as determined by start.html and the simple render function render_start() found in app.py. The plage then looks like this once a voting system is chosen
as determined by littlebase.html and a render function in app.py corresponding to the voting system chosen. Let’s consider when the user selects borda count.
The page for borda count is determined by the template bordacount.html
{% extends 'littlebase.html' %}
{% block header2 %}
<h2>{% block title %}Borda Count{% endblock %}</h2>
{% endblock %}
{% block content %}
<p>
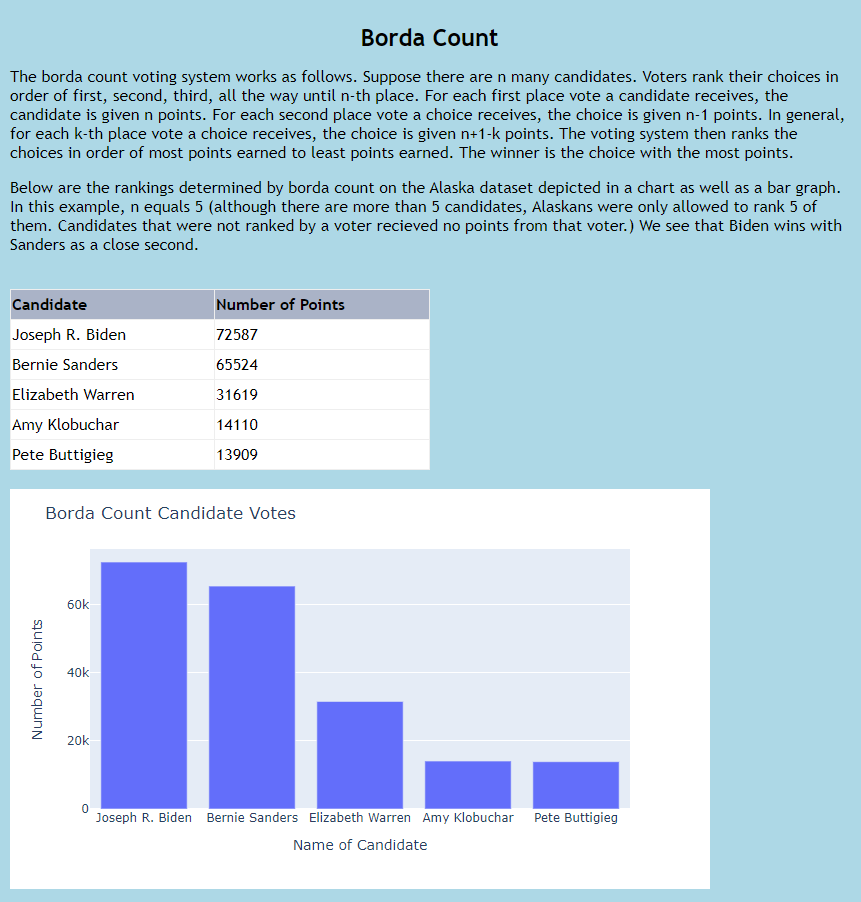
The borda count voting system works as follows. Suppose there are n many candidates. Voters rank
their choices in order of first, second, third, all the way until n-th place. For each first
place vote a candidate receives, the candidate is given n points. For each second place vote a choice
receives, the choice is given n-1 points. In general, for each k-th place vote a choice receives,
the choice is given n+1-k points. The voting system then ranks the choices in order of most points
earned to least points earned. The winner is the choice with the most points.
</p>
<p>
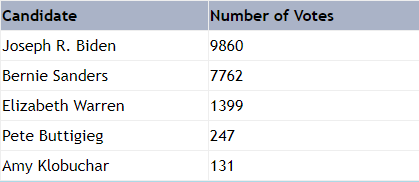
Below are the rankings determined by borda count on the Alaska dataset depicted in a chart as well as a bar graph.
In this example, n equals 5 (although there are more than 5 candidates, Alaskans were only allowed to rank 5 of them.
Candidates that were not ranked by a voter recieved no points from that voter.) We see that Biden wins with Sanders as
a close second.
</p>
<br>
<div class="table">
{{ bordaDF_og | safe }}
</div>
<br>
<div id='chart' class='chart'></div>
<script src='https://cdn.plot.ly/plotly-latest.min.js'></script>
<script type='text/javascript'>
var graphs = {{borda_plot_og | safe}};
Plotly.plot('chart',graphs,{});
</script>
<br>
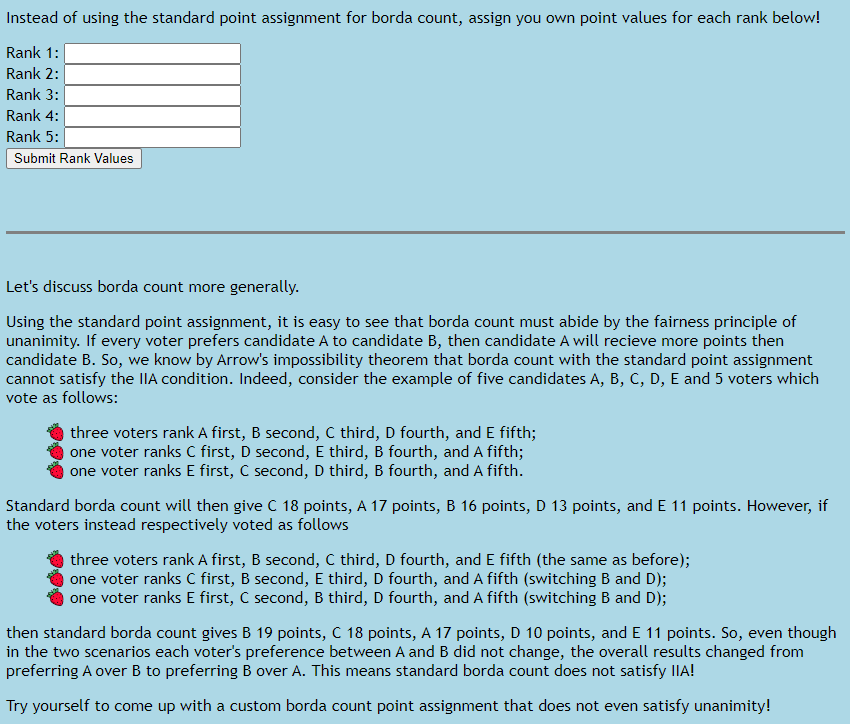
<p>Instead of using the standard point assignment for borda count, assign you own point values for each rank below!</p>
<form method = post>
<label for="rank1">Rank 1:</label>
<input type="number" name = "rank1">
<br>
<label for="rank2">Rank 2:</label>
<input type="number" name = "rank2">
<br>
<label for="rank3">Rank 3:</label>
<input type="number" name = "rank3">
<br>
<label for="rank4">Rank 4:</label>
<input type="number" name = "rank4">
<br>
<label for="rank5">Rank 5:</label>
<input type="number" name = "rank5">
<br>
<input type="submit" name="submit" value="Submit Rank Values">
</form>
<br>
{% if bordaDF_interact %}
<hr class="solid">
<br>
These are the points you chose for each ranking:
<br>
<ul>
<li><b>Rank 1:</b> {{ Rank_1 }} points</li>
<li><b>Rank 2:</b> {{ Rank_2 }} points</li>
<li><b>Rank 3:</b> {{ Rank_3 }} points</li>
<li><b>Rank 4:</b> {{ Rank_4 }} points</li>
<li><b>Rank 5:</b> {{ Rank_5 }} points</li>
</ul>
<br>
<br>
<div class="table">
{{ bordaDF_interact | safe }}
</div>
<br>
<div id='chart2' class='chart2'></div>
<script src='https://cdn.plot.ly/plotly-latest.min.js'></script>
<script type='text/javascript'>
var graphs = {{borda_plot_interact | safe}};
Plotly.plot('chart2',graphs,{});
</script>
{% endif %}
{% endblock %}
{% block results %}
<br>
<hr class="solid">
<br>
<p>
Let's discuss borda count more generally.
</p>
<p>
Using the standard point assignment, it is easy to see that borda count must abide by the fairness principle of unanimity.
If every voter prefers candidate A to candidate B, then candidate A will recieve more points then candidate B. So, we know
by Arrow's impossibility theorem that borda count with the standard point assignment cannot satisfy the IIA condition.
Indeed, consider the example of five candidates A, B, C, D, E and 5 voters which vote as follows:
<ul>
<li>three voters rank A first, B second, C third, D fourth, and E fifth;</li>
<li>one voter ranks C first, D second, E third, B fourth, and A fifth;</li>
<li>one voter ranks E first, C second, D third, B fourth, and A fifth.</li>
</ul>
Standard borda count will then give C 18 points, A 17 points, B 16 points, D 13 points, and E 11 points. However, if the voters instead
respectively voted as follows
<ul>
<li>three voters rank A first, B second, C third, D fourth, and E fifth (the same as before);</li>
<li>one voter ranks C first, B second, E third, D fourth, and A fifth (switching B and D);</li>
<li>one voter ranks E first, C second, B third, D fourth, and A fifth (switching B and D);</li>
</ul>
then standard borda count gives B 19 points, C 18 points, A 17 points, D 10 points, and E 11 points. So, even though in the two scenarios each
voter's preference between A and B did not change, the overall results changed from preferring A over B to preferring B over A. This means
standard borda count does not satisfy IIA!
</p>
<p>
Try yourself to come up with a custom borda count point assignment that does not even satisfy unanimity!
</p>
{% endblock %}which extends littlebase.html and the render function
@app.route("/bordacount/", methods = ["GET", "POST"])
def render_borda():
    """
    renders the bordacount.html template
    depending on which submission button user selects, the function will either render the template with or without the interactive section
    when user selects a voting system while on this page, it renders the selected voting system's page
    args:
        none
    returns:
        a generated template file
    """
    # if the request method is "GET"
    if request.method == "GET":
        # get original borda count dataframe (regular point system) and convert to HTML
        bordaDF_og = get_borda_df()
        bordaHTML_og = bordaDF_og.to_html(index = False)

        # plot for the original borda count data
        borda_plot_og = borda_plot(bordaDF_og)

        # renders bordacount.html template with only the original data
        return render_template("bordacount.html", bordaDF_og = bordaHTML_og, borda_plot_og = borda_plot_og)

    # if the request method is "POST"
    else:
        # if the "POST" method is from the interactive
        if request.form["submit"] == "Submit Rank Values":
            # get original borda count dataframe (regular point system) and convert to HTML
            bordaDF_og = get_borda_df()
            bordaHTML_og = bordaDF_og.to_html(index = False)

            # plot for the original borda count data
            borda_plot_og = borda_plot(bordaDF_og)

            # getting the rank point values that user input
            rank1 = request.form['rank1']
            rank2 = request.form['rank2']
            rank3 = request.form['rank3']
            rank4 = request.form['rank4']
            rank5 = request.form['rank5']

            # taking the rank point values and making a new point_dict variable
            # that will be used in a new get_borda_df() function
            point_dict = {1 : rank1,
                          2 : rank2,
                          3 : rank3,
                          4 : rank4,
                          5 : rank5}

            # get interactive borda count dataframe (user point system) and convert to HTML
            bordaDF_interact = get_borda_df(point_dict)
            bordaHTML_interact = bordaDF_interact.to_html(index = False)

            # plot for the interactive borda count data
            borda_plot_interact = borda_plot(bordaDF_interact)

            # converting user rank point values into integers
            # will be used to show user what ranks they chose
            rank1 = int(rank1)
            rank2 = int(rank2)
            rank3 = int(rank3)
            rank4 = int(rank4)
            rank5 = int(rank5)

            # renders bordacount.html template with both the original and interactive data
            return render_template("bordacount.html", bordaDF_interact = bordaHTML_interact, bordaDF_og = bordaHTML_og, borda_plot_interact = borda_plot_interact, borda_plot_og = borda_plot_og, Rank_1 = rank1, Rank_2 = rank2, Rank_3 = rank3, Rank_4 = rank4, Rank_5 = rank5)

        # if the "POST" method is from the drop down menu
        elif request.form["submit"] == "Submit":
            try:
                # render the url for the voting system user selected
                url = request.form["system"]
                return redirect(url_for(url))
            except:
                # if user selects borda count page while already on the borda count page

                # get original borda count dataframe (regular point system) and convert to HTML
                bordaDF_og = get_borda_df()
                bordaHTML_og = bordaDF_og.to_html()

                # render bordacount.html template with only the original data
                return render_template("bordacount.html", bordaDF_og = bordaHTML_og)
producing a page that looks like this
Note that bordacount.html includes the following:
- text explaining how the voting system works;
- a div for where the table of results should be;
- a div for where the bar chart depicting the results should be;
- integer input boxes for the user to reassign the point system for borda count;
- divs for the table of results and the bar chart of borda count with custom point assignment;
- a block of text explaining how borda count breaks IIA.
The capability for users to reassign the point system for borda count is the reason for the complexity of the render_borda() function. This function has the following control flow:
- if the user navigates onto the borda count page, the funciton simply uses the relevant functions from
plot_data.pyandget_data.pyto display the diagrams relavant to the standard borda count system. - if the user submits a request on the page, check if the request is to change the voting system or if it is to assign custom borda count points.
- if the user submitted a request to navigate to a voting system page, simply navigate to the relevant page.
- if the user submitted a request to reassign the point values for borda count, again uses the relevant functions from
plot_data.pyandget_data.pyto display the additional diagrams relavant to the custom borda count system.
The pages for other voting systems each require their own html template extending littlebase.html as well as their own render function. For the sake of time, we do not cover them all here but again urge the reader to reference our github project.
The final page of the website is the one allowing users to vote on which voting systems are their favorite. The relevant template file is choice.html below
{% extends 'bigbase.html' %}

{% block header2 %}
  <h2>{% block title %}Rank Your Favorite Voting Systems!{% endblock %}</h2>
{% endblock %}

<br>
{% block content %}
<p>Please rank the voting systems from your favorite (rank 1) to least favorite (rank 5). Note that you cannot rank the same voting system multiple times.</p>
<form method="post">
  <label for="rank1">Rank 1: </label>
  <select name="rank1" id="rank1">
    <option value="Borda Count">Borda Count</option>
    <option value="Dictatorship">Dictatorship</option>
    <option value="Instant Runoff">Instant Runoff</option>
    <option value="Plurality">Plurality</option>
    <option value="Top Two Runoff">Top Two Runoff</option>
  </select>
  <br><br>
  <label for="rank2">Rank 2: </label>
  <select name="rank2" id="rank2">
    <option value="Borda Count">Borda Count</option>
    <option value="Dictatorship">Dictatorship</option>
    <option value="Instant Runoff">Instant Runoff</option>
    <option value="Plurality">Plurality</option>
    <option value="Top Two Runoff">Top Two Runoff</option>
  </select>
  <br><br>
  <label for="rank3">Rank 3: </label>
  <select name="rank3" id="rank3">
    <option value="Borda Count">Borda Count</option>
    <option value="Dictatorship">Dictatorship</option>
    <option value="Instant Runoff">Instant Runoff</option>
    <option value="Plurality">Plurality</option>
    <option value="Top Two Runoff">Top Two Runoff</option>
  </select>
  <br><br>
  <label for="rank4">Rank 4: </label>
  <select name="rank4" id="rank4">
    <option value="Borda Count">Borda Count</option>
    <option value="Dictatorship">Dictatorship</option>
    <option value="Instant Runoff">Instant Runoff</option>
    <option value="Plurality">Plurality</option>
    <option value="Top Two Runoff">Top Two Runoff</option>
  </select>
  <br><br>
  <label for="rank5">Rank 5: </label>
  <select name="rank5" id="rank5">
    <option value="Borda Count">Borda Count</option>
    <option value="Dictatorship">Dictatorship</option>
    <option value="Instant Runoff">Instant Runoff</option>
    <option value="Plurality">Plurality</option>
    <option value="Top Two Runoff">Top Two Runoff</option>
  </select>
  <br><br>
  <input type="submit" value="Click to submit your vote!">
</form>

{% if submitted %}
  <p>Thanks for your vote!</p>
{% endif %}

{% if badsubmit %}
  <p>Please make sure that you only vote for each option once.</p>
{% endif %}

{% endblock %}

{% block results %}
<p>Here are the current favorites based on each voting system.</p>
<ul>
<li><b>Borda Count:</b> {{results["borda"]}}</li>
<li><b>Dictatorship:</b> {{results["dictator"]}}</li>
<li><b>Instant Runoff:</b> {{results["irv"]}}</li>
<li><b>Plurality:</b> {{results["plural"]}}</li>
<li><b>Top Two Runoff:</b> {{results["toptwo"]}}</li>
</ul>
{% endblock %}

{% block button %}
<br>
<div class = "BACK">
  <a href = "{{ url_for('render_start') }}" >
    <button>BACK</button>
  </a>
</div>
{% endblock %}
This template provides the users with a drop down menu to choose the system the want to assign to each rank. It includes a thank you message in the event the user submits a valid vote, and also includes an error message in the event the user submits an invalid vote such as ranking the same voting system across multiple rankings. Finally, the template includes an area where the winner of the vote according to each voting system is displayed, followed by a back button. The render function which fills in the template upon a user submission is
@app.route('/FavoriteSystems/', methods=['POST','GET'])
def render_choice():
    """
    renders the choice.html template
    user inputs a voting system for each drop down menu
    args:
        none
    returns:
        a generated template file
    """
    # if user submits a vote
    if request.method == 'POST':
        # store the vote in the database
        rank1 = request.form['rank1']
        rank2 = request.form['rank2']
        rank3 = request.form['rank3']
        rank4 = request.form['rank4']
        rank5 = request.form['rank5']
        vote = [rank1, rank2, rank3, rank4, rank5]
        if len(list(set(vote))) == 5: # if valid vote (all unique inputs)
            voting_systems.add_vote(vote)
            results = voting_systems.get_favorite_systems() #get results after submission
            # display the thank you message
            return render_template('choice.html', submitted=True, results=results, badsubmit=False)
        else:
            results = voting_systems.get_favorite_systems()
            return render_template('choice.html', submitted=False, results=results, badsubmit=True)
    # otherwise display the standard page
    else:
        results = voting_systems.get_favorite_systems()
        return render_template('choice.html', submitted=False, results=results, badsubmit=False)
and this page looks like
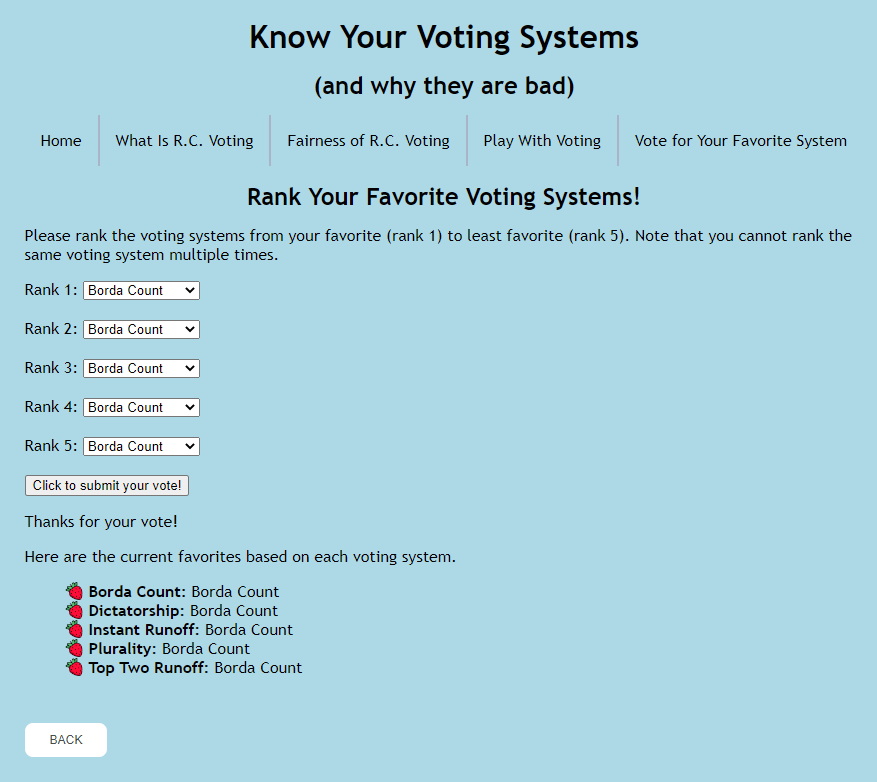
upon submitting the vote of Borda Count first, dictatorship second, instant runoff third, pluarlity fourth, and top two runoff fifth.
Conclusion: Remarks and Ethics
We conclude with three remarks. First, we’d like to note that our voting algorithms in voting_systems.py are designed to be usable beyond the scope of this project, provided that the database is modified. Similarly, the functions used for visualization in plot_data.py1 and get_data.py are also designed to be used on any ranked choice election data.
Second, the Alaska election data has two peculiarities:
- there were eight candidates but voters were only allowed to rank their top five;
- voters were allowed to skip assigning a canidate to a particular rank (for example, one voter ranked Sanders first, skipped rankings 2 through 4, and then ranked Biden fifth).
These two characteristics of the Alaska voting system can cause some slightly unintended behaviour for certain ranked choice voting systems. For us, the only affected voting system was instant runoff, as votes may be “lost” in between rounds of instant runoff due to voters simply skipping rankings and not being able to rank all eight candidates at once but instead only five of them. This phenomenon is explained more thoroughly on the website, and is so small as to not affect the results of the election at all. It is moreover, presumambly, a phenomenon that Alaska itself faced when conducting the election.
Our third remark is that, because this project is more educational than a tool to be used by other people, there aren’t really any serious ethical ramifications. Ultimately, the biggest risk this website poses is making the reader lose faith in democracy. We want viewers of the website to come out not with a cynical perspective that no voting system can be perfect, but rather with the knowledge that, despite these shortcomings, the consistency in the Alaska dataset shows that voting systems can be more or less robust. We believe we have structured the website to get this point accross.